.png)
.png)
One of the most common strategies sellers consider when selling a home in Greenville, SC is pricing slightly above market value “to leave room to negotiate.”
On the surface, this sounds logical:
- Start high
- Negotiate down
- Still end up at a strong price
But in today’s Greenville real estate market, the data tells a very different story.
Based on recent analysis of Greater Greenville Association of REALTORS® MLS data, there is a clear relationship between:
- How long a home sits on the market
- And the percentage of its original list price it ultimately sells for
The longer a home sits, the more negotiating power buyers tend to gain — and the lower the final sales price often becomes.
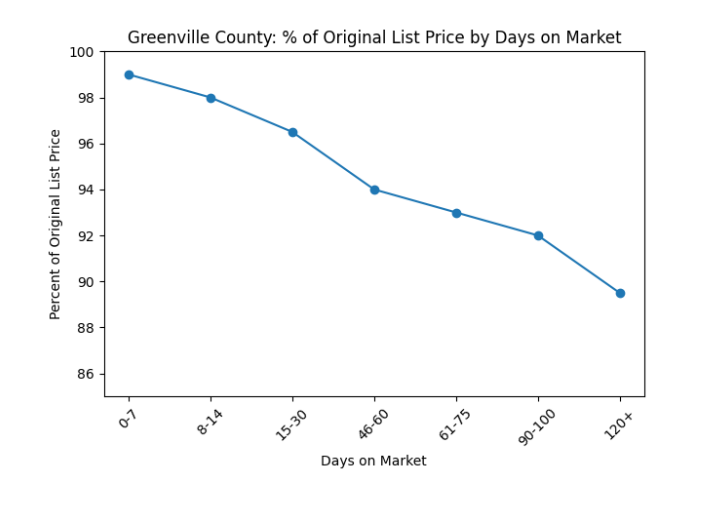
What the Data Shows: Days on Market vs. Final Sale Price
Recent Greenville County data shows a consistent trend between days on market and percentage of original list price received.
Homes that sell quickly:
- 0–7 days: ~99% of list price
- 8–14 days: ~98% of list price
- 15–30 days: ~96–97% of list price
Homes that sit longer:
- 46–60 days: ~94% of list price
- 61–75 days: ~93% of list price
- 90–100 days: ~92% of list price
- 120+ days: ~89–90% or less
Once a home reaches 60+ days on the market in Greenville County, the final sales price drops noticeably compared to homes that sell in the first few weeks.
The Real Cost of Overpricing: A Practical Example
Scenario A: Correctly Priced Home
- List price: $450,000
- Sells in 12 days
- Final price: 98% of list
- Sale price: $441,000
Scenario B: Overpriced Home
- Initial list price: $475,000
- Sits on market for 75 days
- Requires multiple price reductions
- Final price: 92% of original list
- Sale price: $437,000
The Real Difference
- 63 extra days on market
- $4,000 lower sale price
- ~$6,600+ in holding costs (mortgage, taxes, insurance, utilities)
Total impact: $10,000+ difference — and in many cases, it’s much more once homes cross the 90-day threshold.
How Negotiation Behavior Changes Over Time
The most powerful shift isn’t just price — it’s psychology.
When a home is new to the market:
- Buyers assume competition
- Offers are stronger
- Negotiations are tighter
When a home has been sitting:
- Buyers assume something is wrong
- They believe the seller is getting anxious
- They negotiate aggressively
Your local data clearly shows this shift.
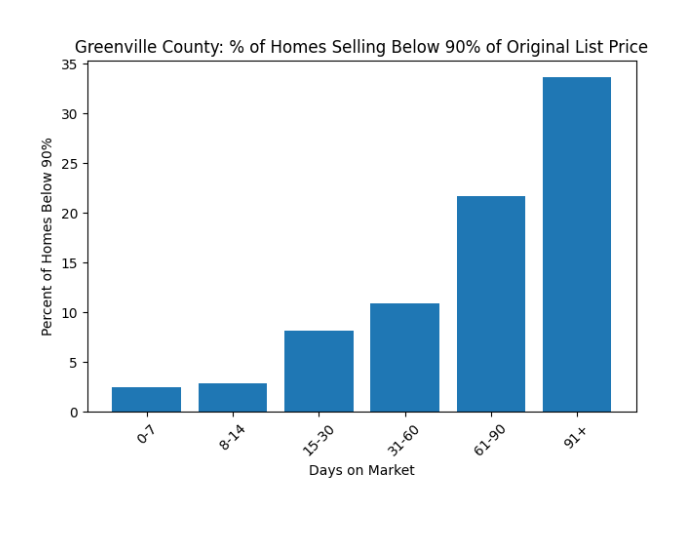
Percentage of Homes Selling Below 90% of Original List Price
- 0–7 days: 2.4%
- 8–14 days: 2.9%
- 15–30 days: 8.2%
- 31–60 days: 10.9%
- 61–90 days: 21.7%
- 91+ days: 33.6%
That means:
- In the first two weeks, only about 1 in 40 homes sell below 90% of list price.
- After 90 days, 1 in 3 homes sell below 90% of the original list price.
That’s not a small shift — it’s a dramatic change in negotiation power.
Why the First 2–3 Weeks Are Critical
In most MLS systems and major portals:
- New listings are pushed to email alerts
- They appear at the top of search results
- They receive the most views and showing activity
Industry-wide portal data consistently shows that the majority of buyer activity occurs in the first 2–3 weeks.
If your home is:
- Well-prepared
- Priced correctly
- Launched strategically
That initial window can create urgency and stronger offers.
If it’s overpriced during that window, momentum is difficult to recover.
The Bottom Line for Greenville Sellers
Pricing your home correctly from day one protects:
- Your negotiating position
- Your timeline
- Your final sales price
- Your net proceeds
Overpricing can:
- Increase days on market
- Lead to price reductions
- Attract more aggressive buyers
- Reduce final sale price
Strategic pricing, based on real market data, creates leverage instead of losing it.
Research Methodology & Data Scope
The data referenced in this article is based on analysis of Greater Greenville Association of REALTORS® MLS sales over the past 90 days.
To maintain consistency and relevance, the dataset included:
- Resale single-family homes only
- Located in Greenville County, SC
- Priced above $200,000
- Closed within the past 90 days
Homes below $200,000 were excluded because they tend to attract a higher percentage of investor activity in our market, which can skew negotiation behavior.
Condos and townhomes were also excluded to avoid mixing valuation dynamics across property types.
The goal was to provide the most relevant and recent snapshot of typical homeowner selling behavior in today’s Greenville market.
Individual results may vary based on condition, location, price range, and market timing.